Reports
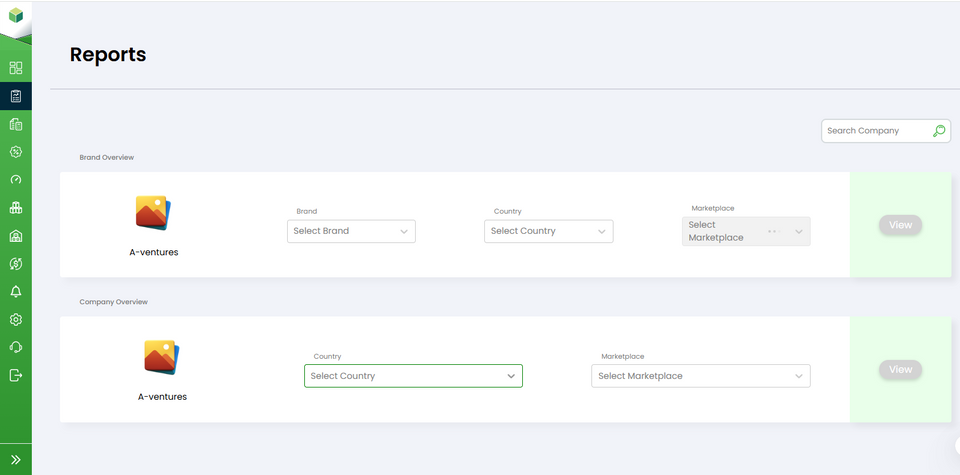
The Reports section allows you to view performance reports for brands and companies. You can select a brand, country, and marketplace to generate brand-level reports, or select a country and marketplace to generate company-level reports. After selecting the required filters, click the View button to see the detailed report.
- Log in to your account.
- Navigate to the side bar.
- Click on the "Reports" tab.
- Once you click Reports, you'll be shown two options:
1.Brand Overview
2.Company Overview
Select the one you want to analyse.
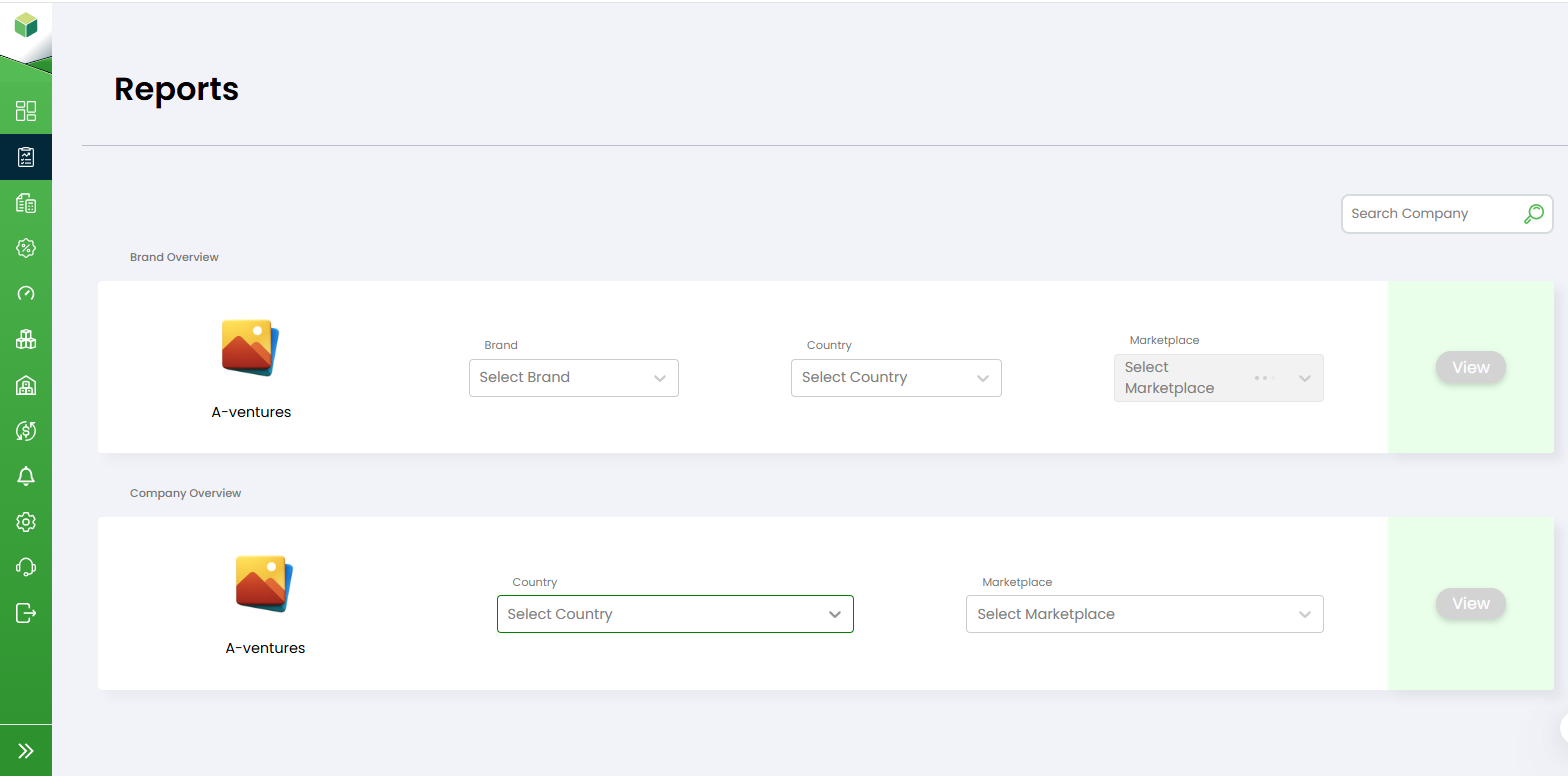
1.Brand overview:
The Brand Overview gives a quick summary of a brand’s performance across a selected country and marketplace, showing key insights like sales, revenue, inventory, delivery speed, and top products. It helps you understand how the brand is performing overall. Follow the steps below to generate the report.
- Select the brand name from the drop-down menu.
- Select the country from the drop-down menu.
- Select the marketplace from the drop-down menu.
- Click the View button to generate the report.
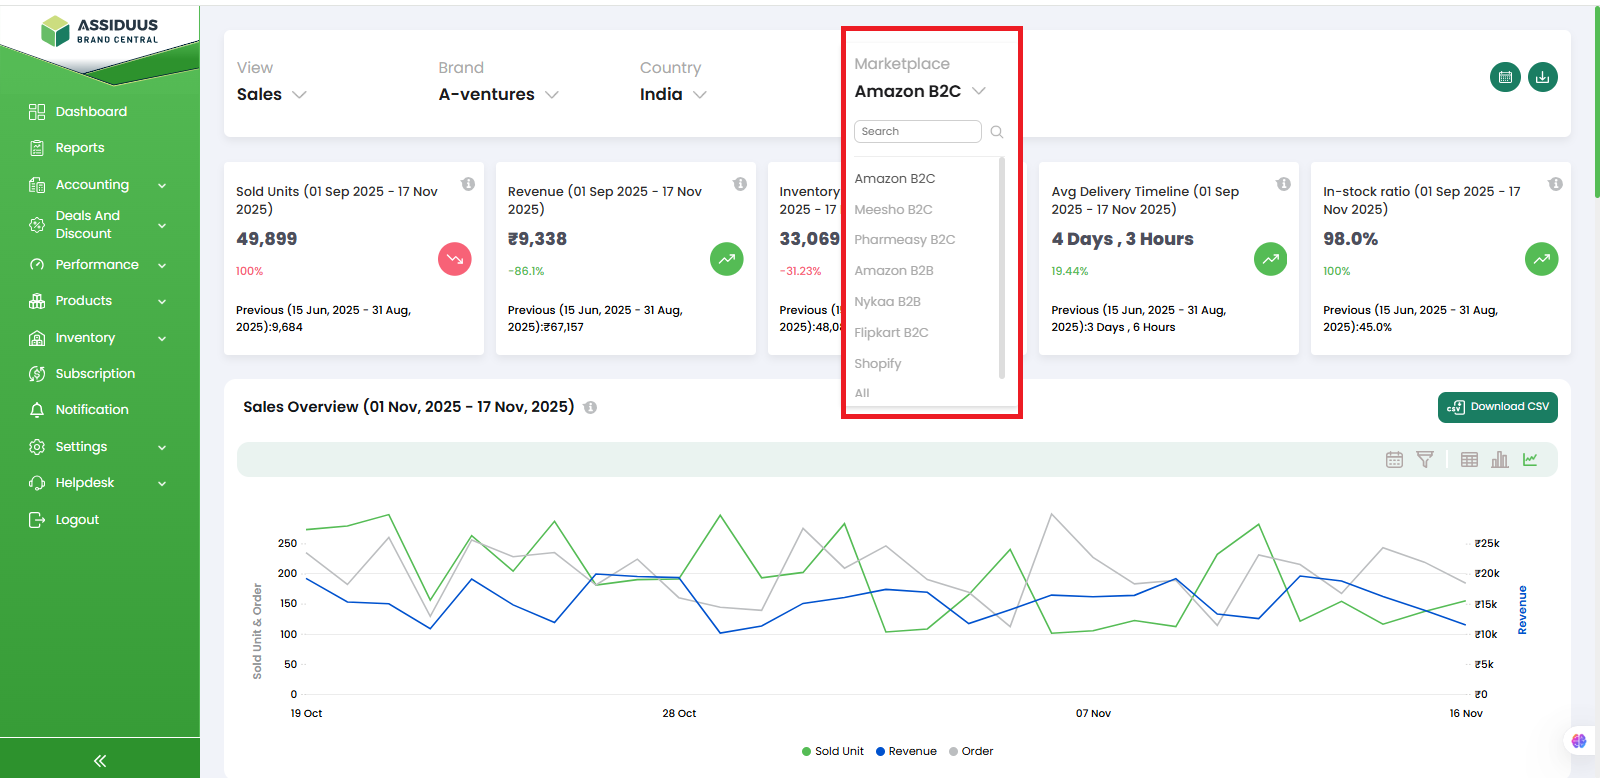
Within the generated report, you'll find four drop-down menus. Let's explore their functionalities:
1.View: This drop-down menu offers several options to further refine the data you wish to examine. You can select between sales, Advertisement, Primary analytics or detailed analytics. This helps you focus on the specific area of interest within your chosen brand , country and marketplace.
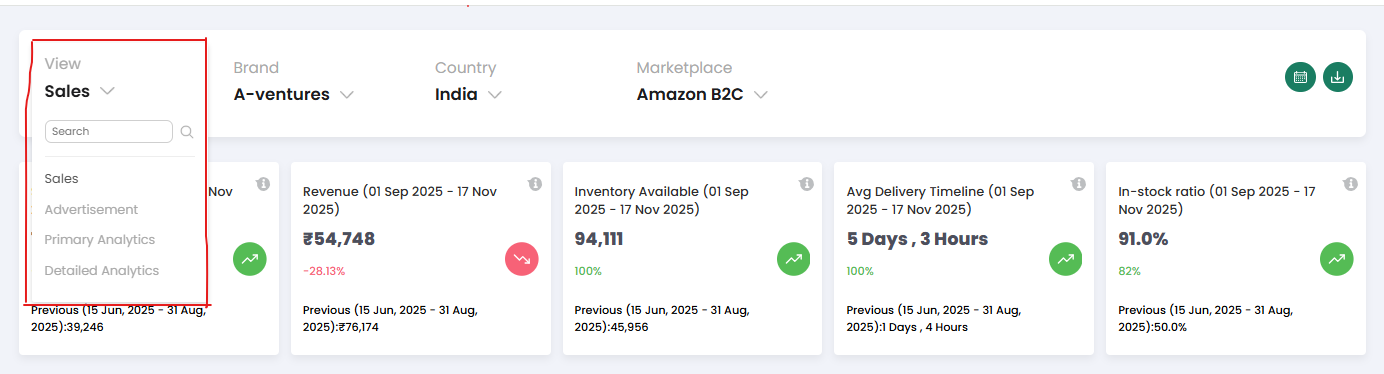
a. Sales Report:Provides a quick view of your brand’s sales trends, revenue, delivery speed, and top-selling products.
This report includes key performance nuggets such as Sold Units, Revenue, In-Stock Ratio, Inventory Availability, and Delivery Speed. It also provides visual charts like Sales Overview, Delivery Performance charts, Sales Funnel, Top Products and stock overview helping you track sales trends and customer journey.
b. Advertisement Report:Gives insights into your ad performance, including spend, impressions, clicks, revenue, ROAS, ACOS, and campaign-level details to help measure the effectiveness of your advertising.
This report contains advertising-focused nuggets such as Total Spend, CPC, Revenue from Ads, ROAS, and CTR, along with period-to-period comparisons. It also includes a detailed view with Funnel charts (Impressions → Clicks → Orders), line charts, and table views. Below this, the report provides multiple breakdowns including Advertising by Campaign, Advertising by Product, Advertising by Week, and Advertising by Search Term, each showing metrics like spends, sales value, CTR, ROAS, and ACOS. These charts and tables help you analyse overall ad performance and understand how effectively your ads are driving sales.
c. Primary Analytics Report:Shows key brand performance details such as ratings, sales by states, sales by regions, and other important insights that help you understand how your products are performing across different locations.
This report displays high-level brand insights through a combination of nuggets and charts. The nuggets include key metrics such as Sales Comparison, Advertisement Comparison, Sales by States, Sales by Regions, Out-of-Stock Ratio, and Product Ratings. The charts include geographic visualisations, regional performance tables, rating trend line charts, and top-product comparison graphs. Together, these insights provide a clear snapshot of your brand’s overall health and performance across different locations.
d. Detailed Analytics Report:Offers key insights into customer repeat behavior, product combinations (MBA), SKU-wise performance, and daily sales and traffic trends to help you understand overall brand health.
It includes nuggets such as Repeat Purchase Behavior and Market Basket Analytics, along with detailed charts showing daily Sales & Traffic trends, page views, sessions, units ordered, revenue, Buy Box %, and conversion rate. These sections help you understand customer repeat patterns, product combination trends (MBA), SKU interactions, and overall brand health through daily performance visualisations.
2. Brand:Use this drop-down menu to filter the report by different brands associated with your activities. Choose the relevant brand to view the corresponding data for a more targeted analysis.

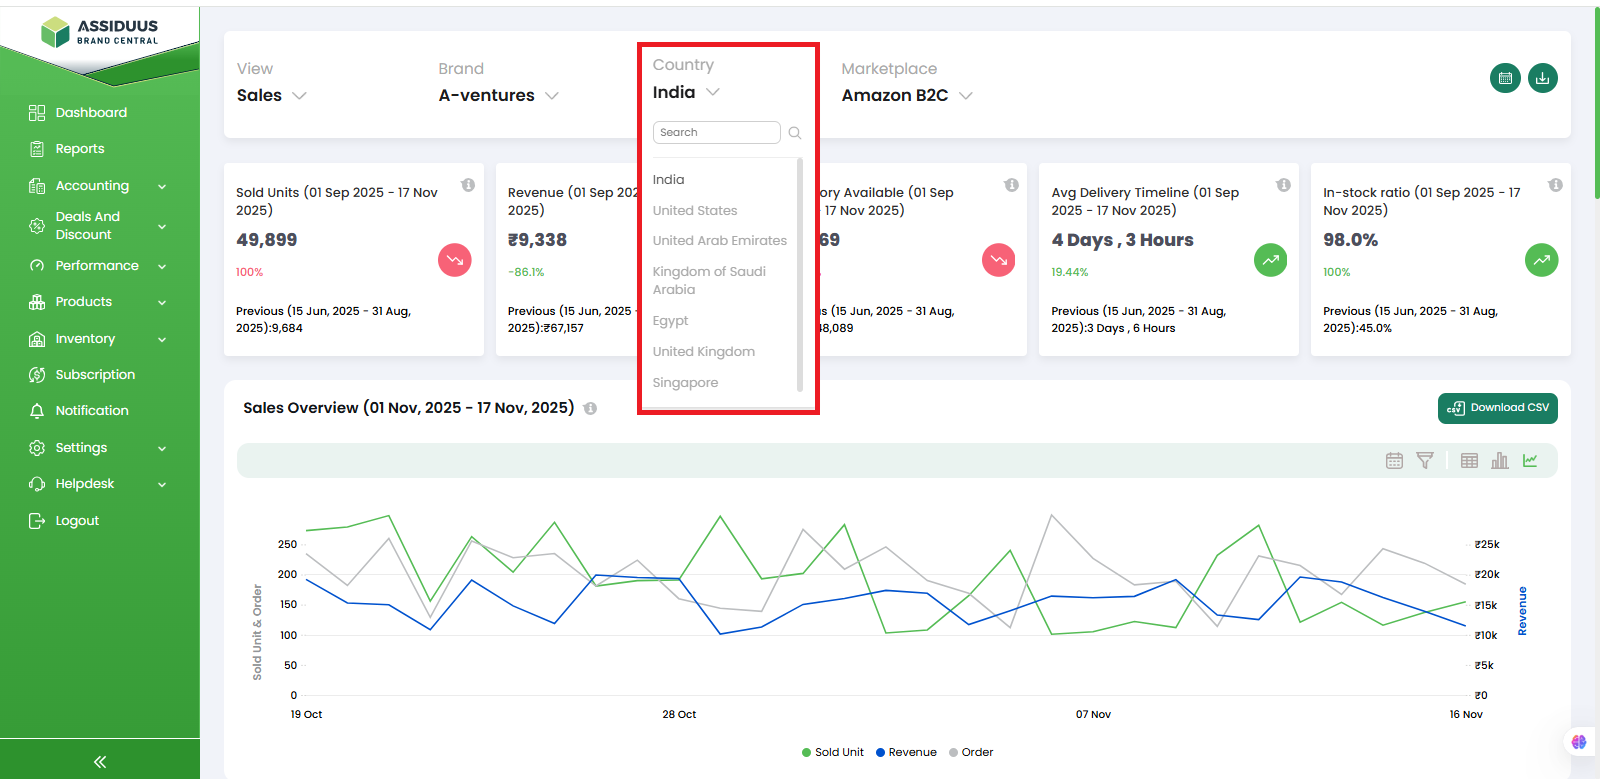
3.Country: Similar to the Brand drop-down menu, the Country drop-down menu allows you to filter the report based on different countries associated with your operations. Select the desired country to observe the data specific to that region.
4.MarketPlace: Use this drop-down menu to filter the report by different marketplaces where your brand is active. Select the appropriate marketplace (such as Amazon, Flipkart, etc.) to view data specific to that platform for more accurate and focused analysis.
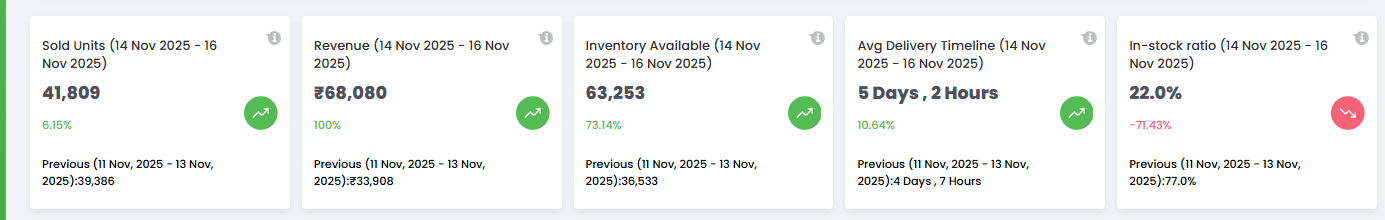
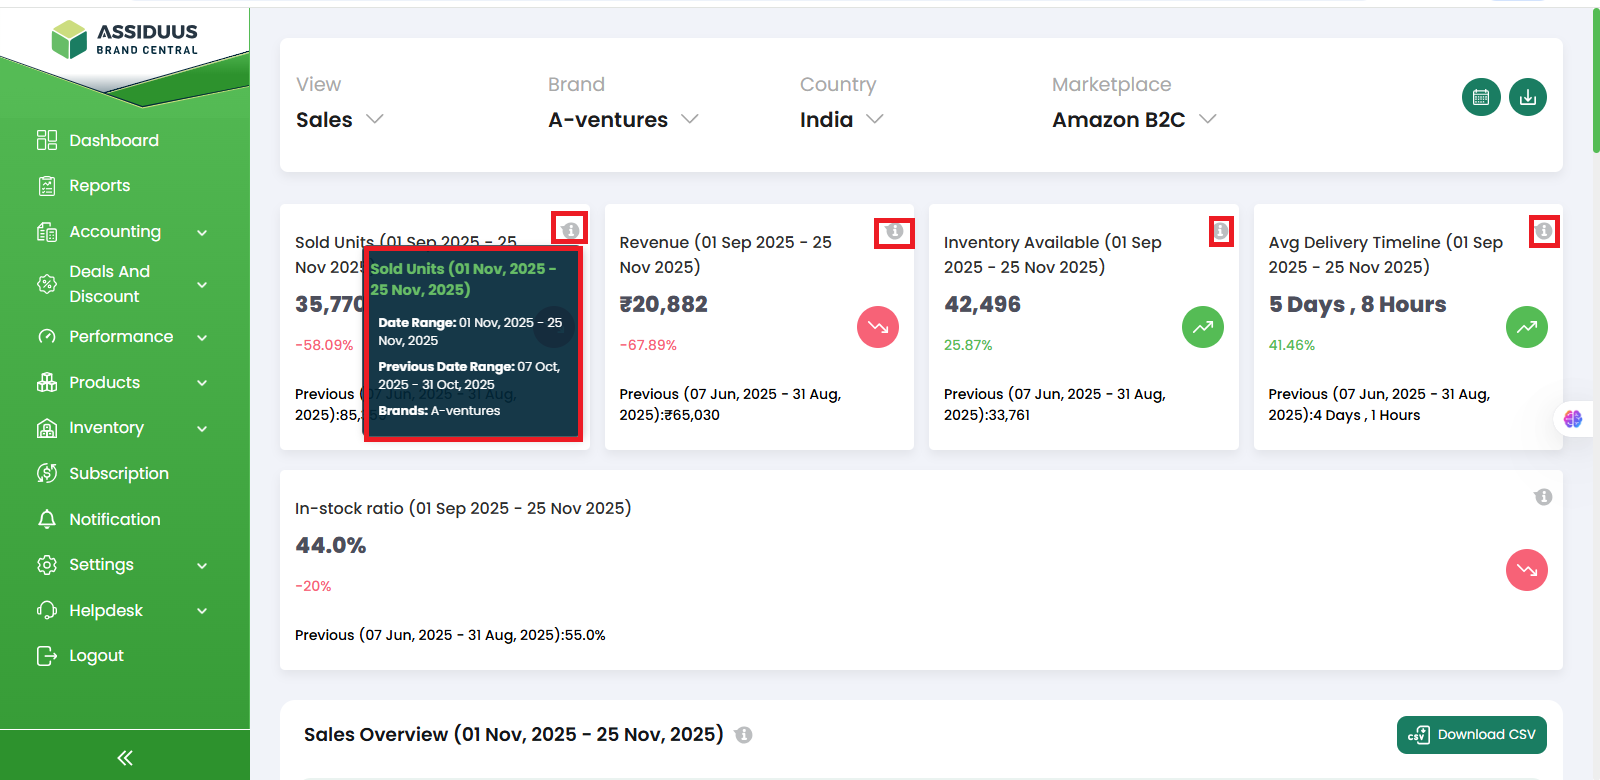
Within each report, you'll find various subsections providing important metrics and insights. Here are some key sections you can explore:
a .Sold Units: Shows how many units were sold in the selected date range.
b. Revenue: Shows the total revenue earned during the selected date range.
c. Inventory Available: Shows the total available stock for the selected date range.
d. Average Delivery Timeline: Shows the average time taken to deliver products.
e. In-stock Ratio: Shows the percentage of products currently available in stock.
It also include-
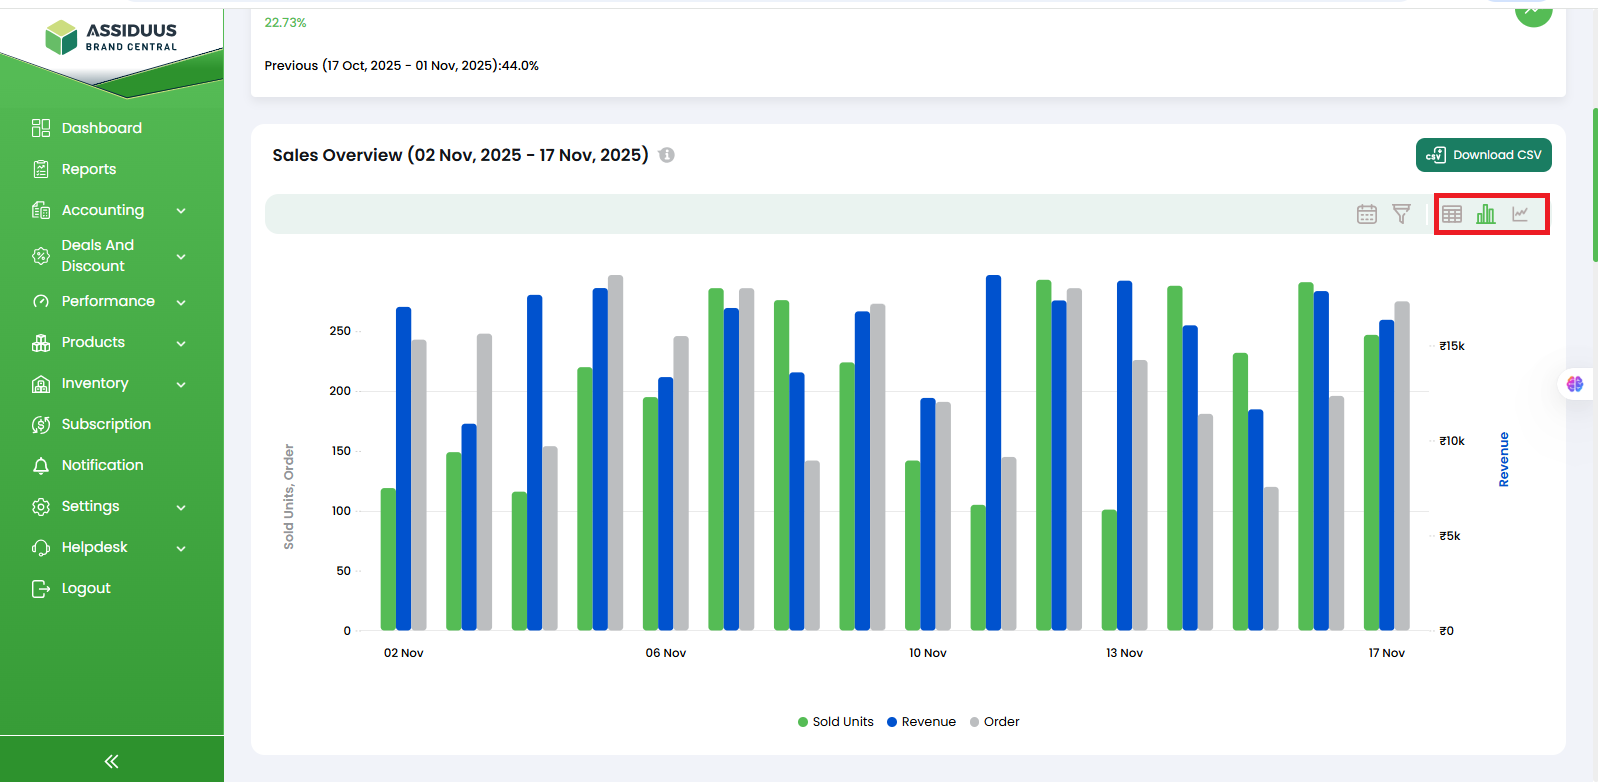
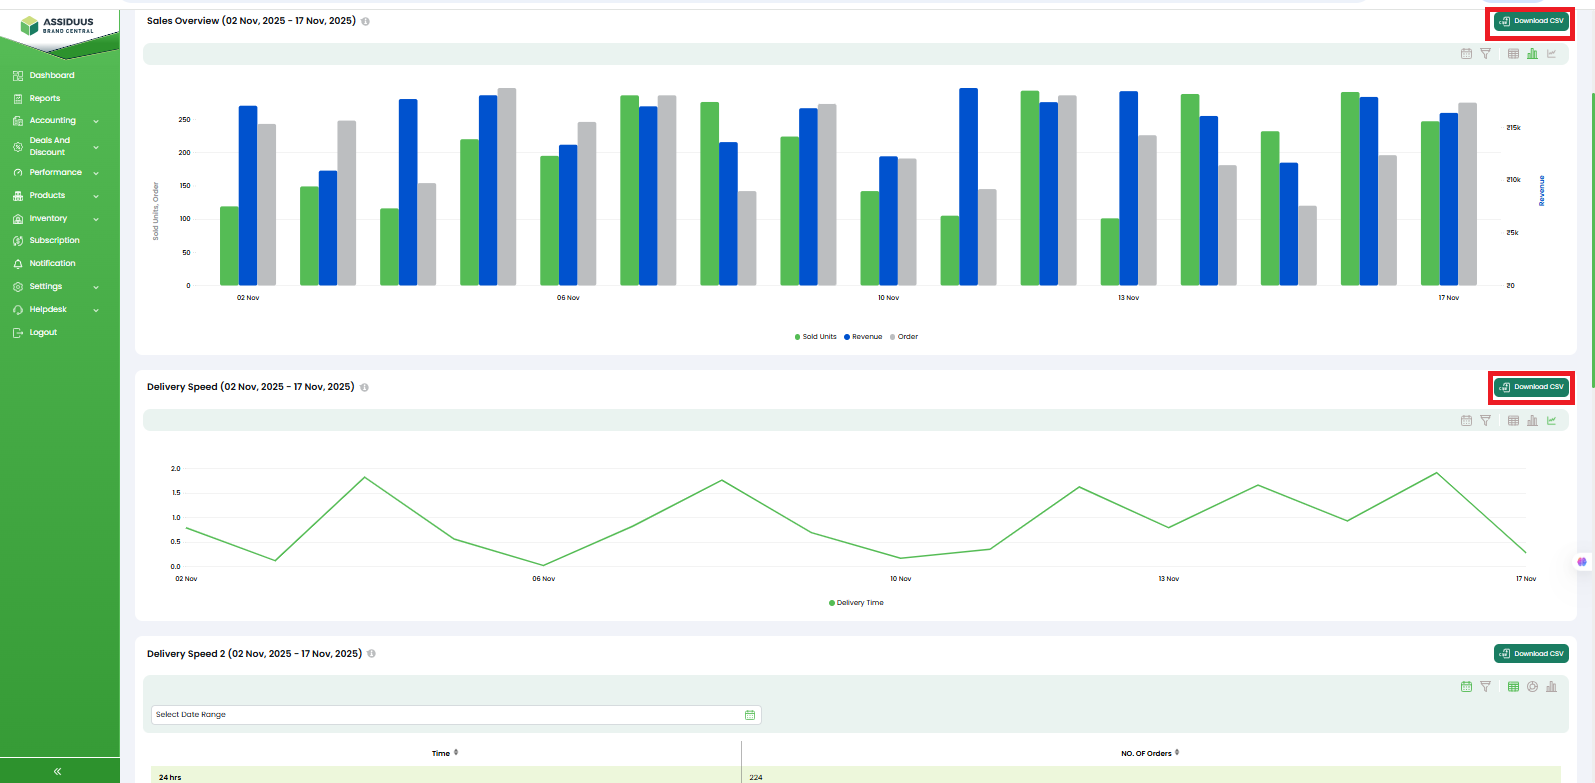
- Sales Overview Chart: Shows overall sales trends (sold units, revenue, orders) for the selected period.
- Delivery Speed:Displays how long deliveries are taking across different time brackets (1–2 days, 3–4 days, etc.).
- Delivery Speed (%): Shows delivery performance in percentage format for quick comparison.
- Sales Funnel: Visual journey from sessions → page views → add to cart → orders, highlighting customer drop-off points.
- Top Products by Day: Shows the top-selling products for the selected date range.
- Additional Sales Trend Chart: Another line chart comparing sold units, revenue, and orders over time.
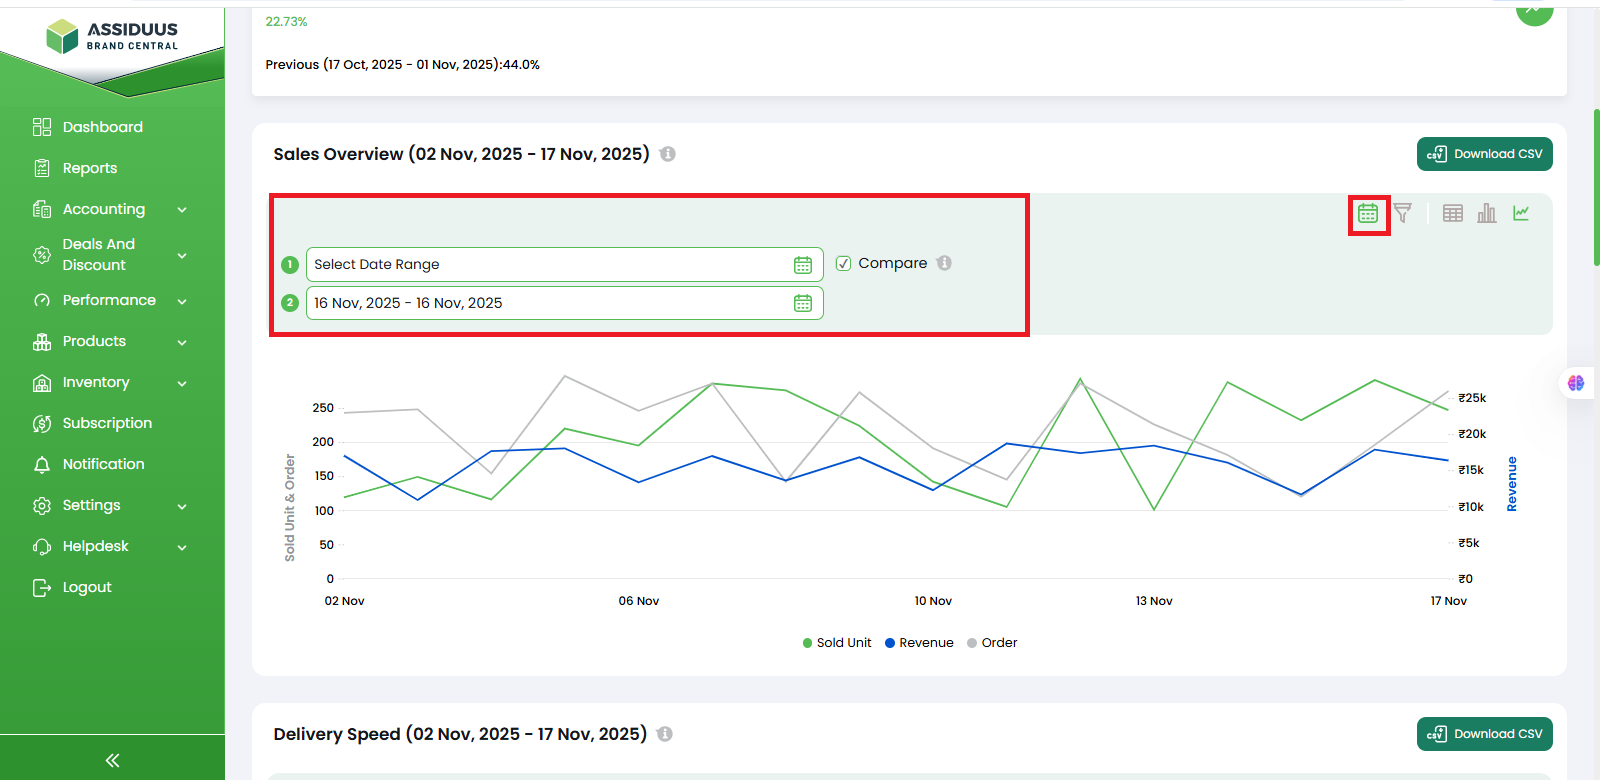
To customise how these charts are displayed, the top-right chart controls allow you to adjust the date range, apply filters, view tables, switch chart formats and download CSV.
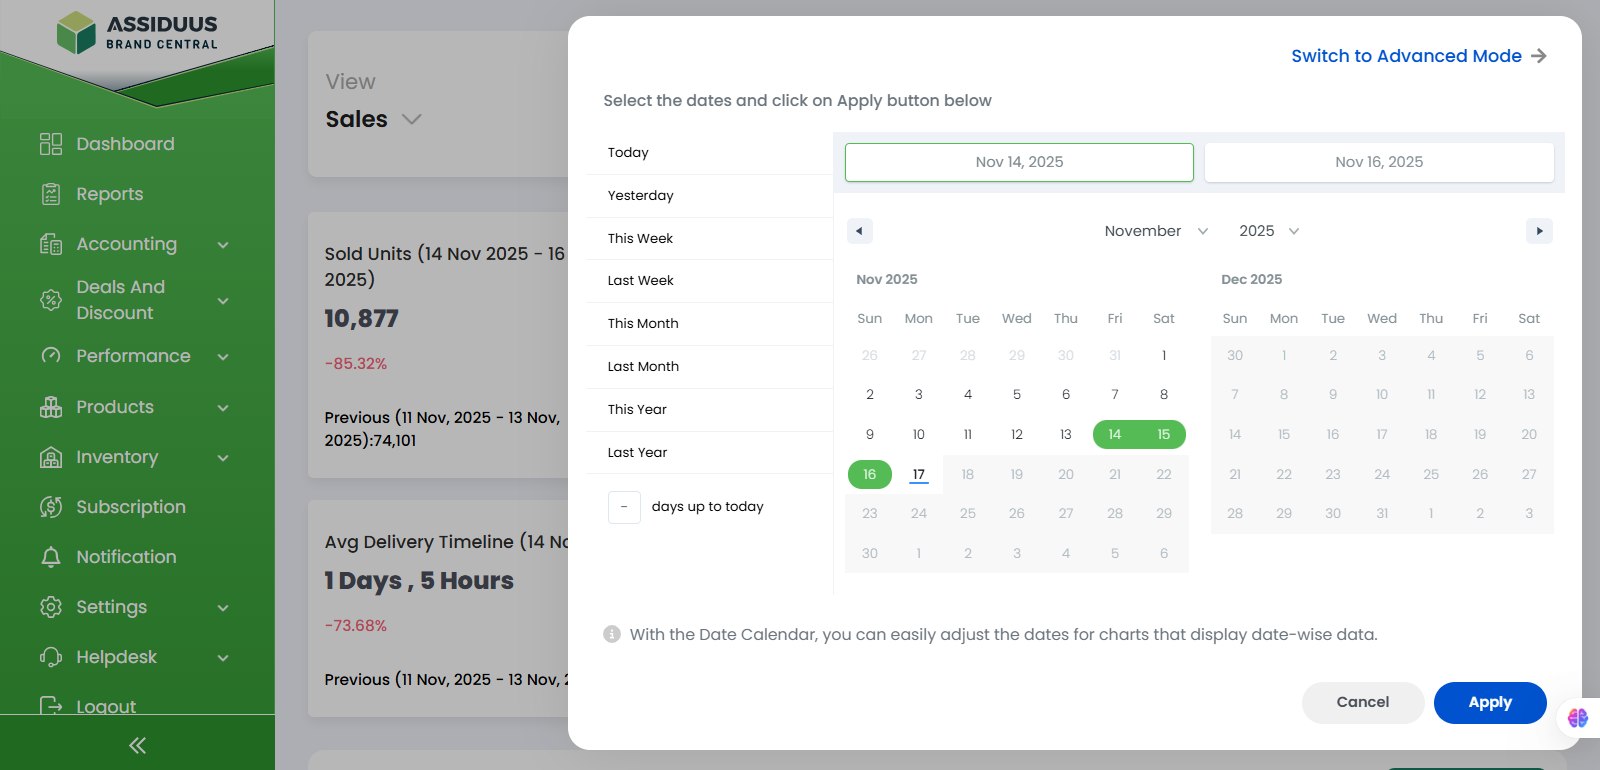
- Date Range Selector (Calendar Icon): Choose the time period you want to view data for.
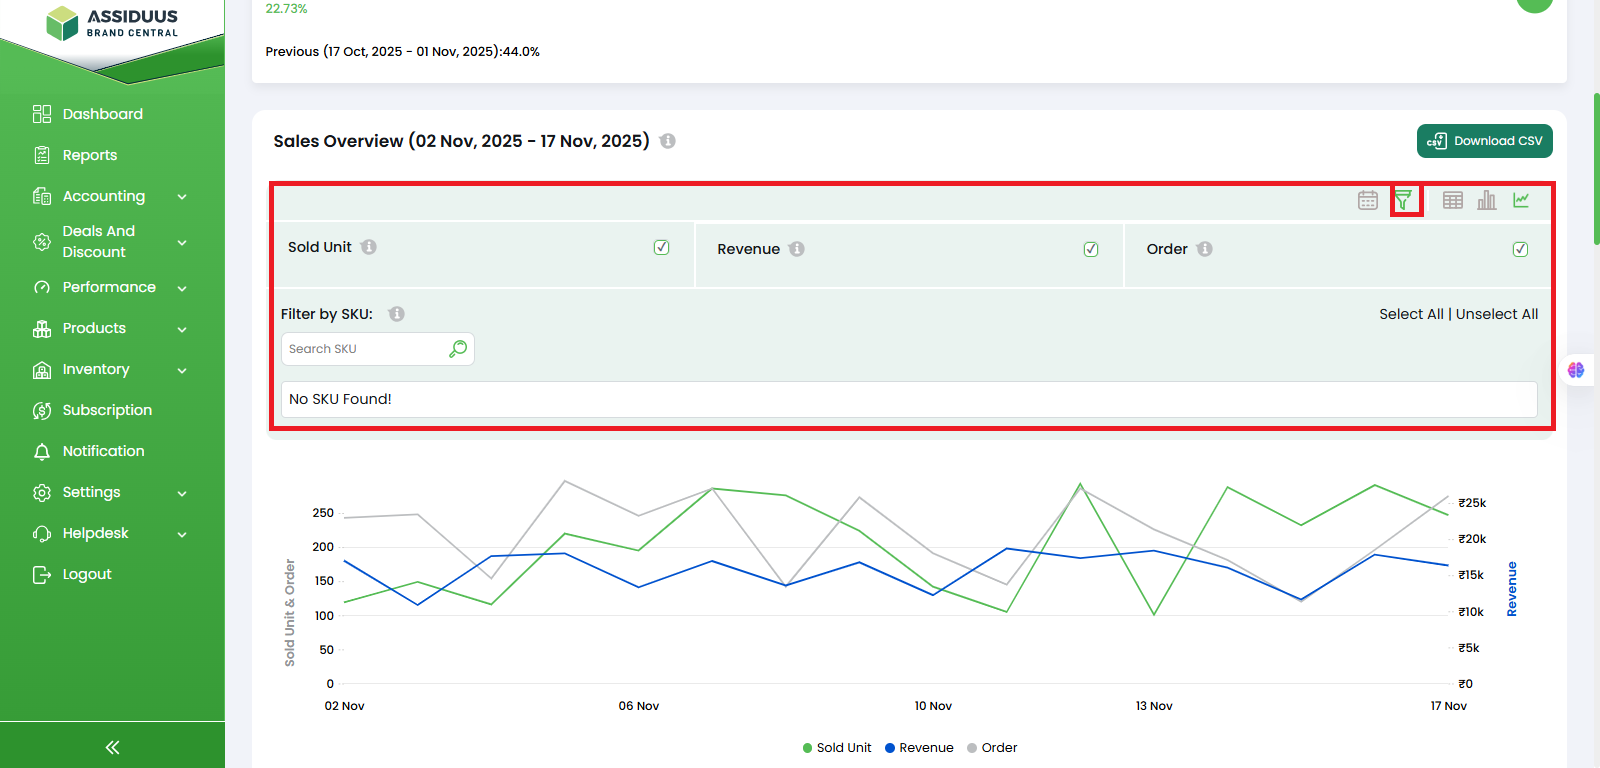
- Filter Icon: Apply extra filters (like sold unit, order, revenue) to refine the data shown.
- Table View Icon: Switches the chart into a table format for easy data reading.
- Bar Graph View: Shows the data in a bar chart for better visual comparison.
- Line Graph View: Shows the data in a line chart to track trends over time.
- Download CSV (Each Section/Chart):Every chart or section has its own Download CSV button. You can export data for that specific chart individually.
- Icon (i): By clicking on the "i" icon within each section, you can access additional information such as the date range covered by the data. This feature allows you to understand the time period for which the metrics are presented.
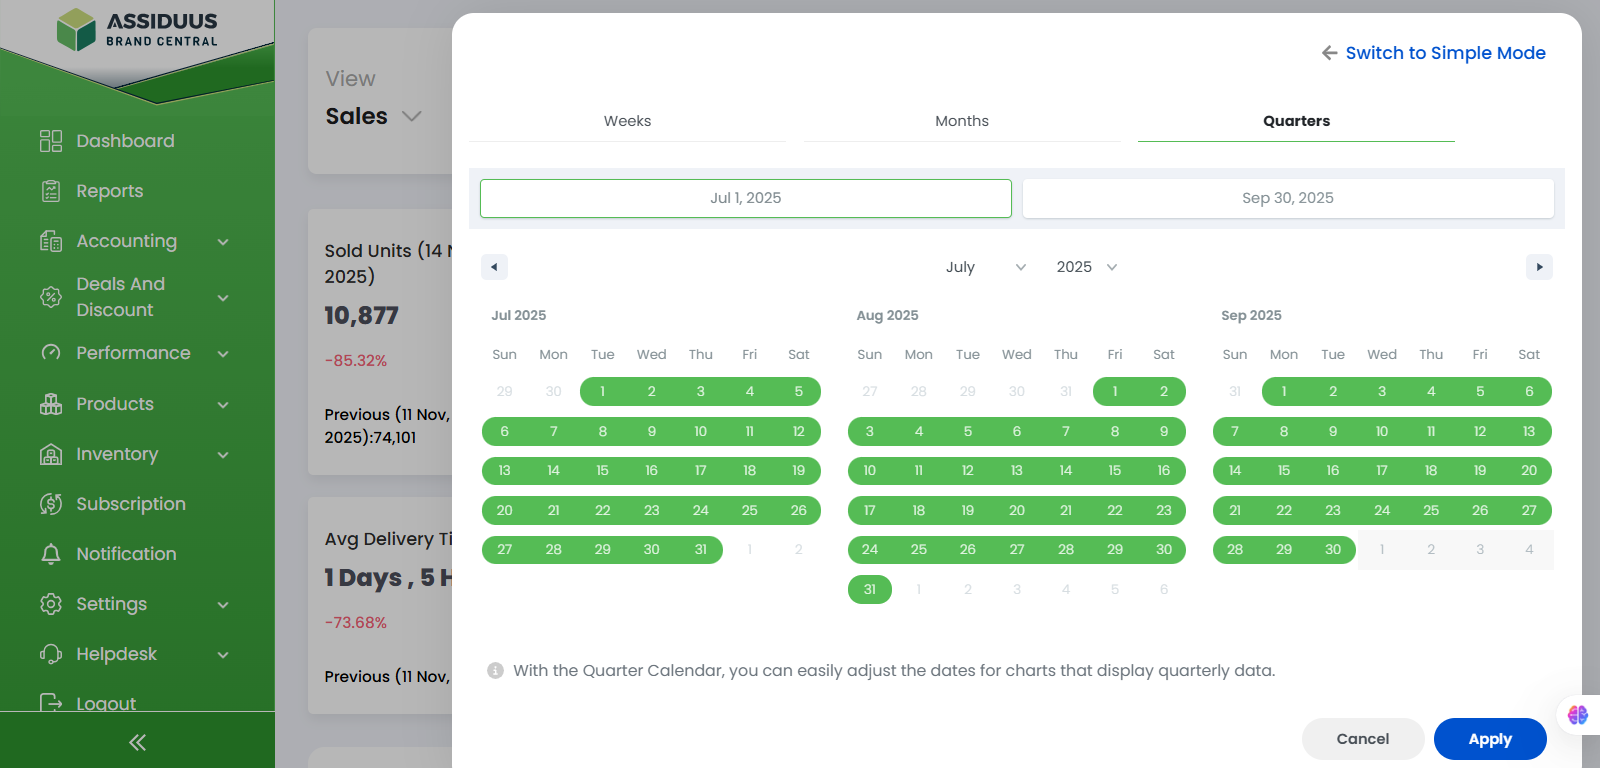
- Date Range Selection: On the top right corner of the report page, you will find a calendar. By default, it is set to "Simple Mode" for selecting specific dates. However, you can switch to "Advanced Mode" to select time periods such as day, week, month, or quarter.
- Exporting Data: Located in the top right corner of the report page, there is an option to export data in various formats, including JPG, CSV, PDF, and PPT. This allows you to save or share the whole page reports with others.

2.Company Overview:
The Company Overview provides a consolidated performance summary of all brands under a company for a selected country and marketplace. It shows key metrics like total sales, revenue, inventory levels, delivery performance, and overall company trends. This report helps you understand the company’s overall performance across different marketplaces. Follow the steps below to generate the report.
- Select the country from the drop-down menu.
- Select the marketplace from the drop-down menu.
- Click the View button to generate the report.
Within the generated report, you'll find drop-down menus similar to the brand overview with company name at top right
